Schmidt Ocean Institute Fictional Layout of an InfoGraphic
by Christa Bianchi
This layout considers and demonstrates the following:
1. A public audience
2. Meant to showcase SOI achievements and educate about what lives in the ocean
3. Fictitious and inaccurate info, rough retouching – this is purely a demo
4. This layout demonstrates graphics for storytelling, using many different types of information (depth, temperature, factoids, portrait, equipment, and organism shots)
5. This layout demonstrates the usage of the brand elements (typeface, colors, and logo wave)
Please click on the image to see a much larger PDF version, and feel free to discuss!
It’s Time to Rebrand, and Meet the 4 Brand Requirements of Now
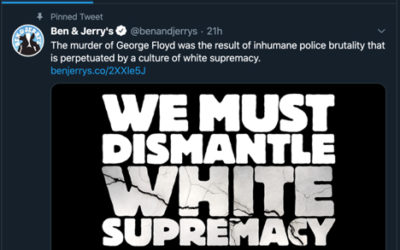
It’s not a rebrand, but may shape up like one: Ben & Jerry’s made a powerful stand on social media, joining so many other voices outraged by the murder of George Floyd at the hands of police in Minneapolis, in an extraordinary statement. This statement is...
Is Your Digital Marketing Responding to the New Normal?
With virtually everyone working from home, your website is suddenly very important -- making now a good time to update your digital marketing strategy. Everyone is doing everything online now, which means more people are viewing your website and digital marketing....
As we all try to stake out a new normal in our work and personal lives, one question keeps coming up: What Matters, Now?
What matters now, and how do we address it? Many of us are unsure about how to proceed in this crisis, especially in the ways of marketing. Our old tactics, largely originated in the 19th Century by Thomas J. Barratt, used very simple language to entice consumers to...


